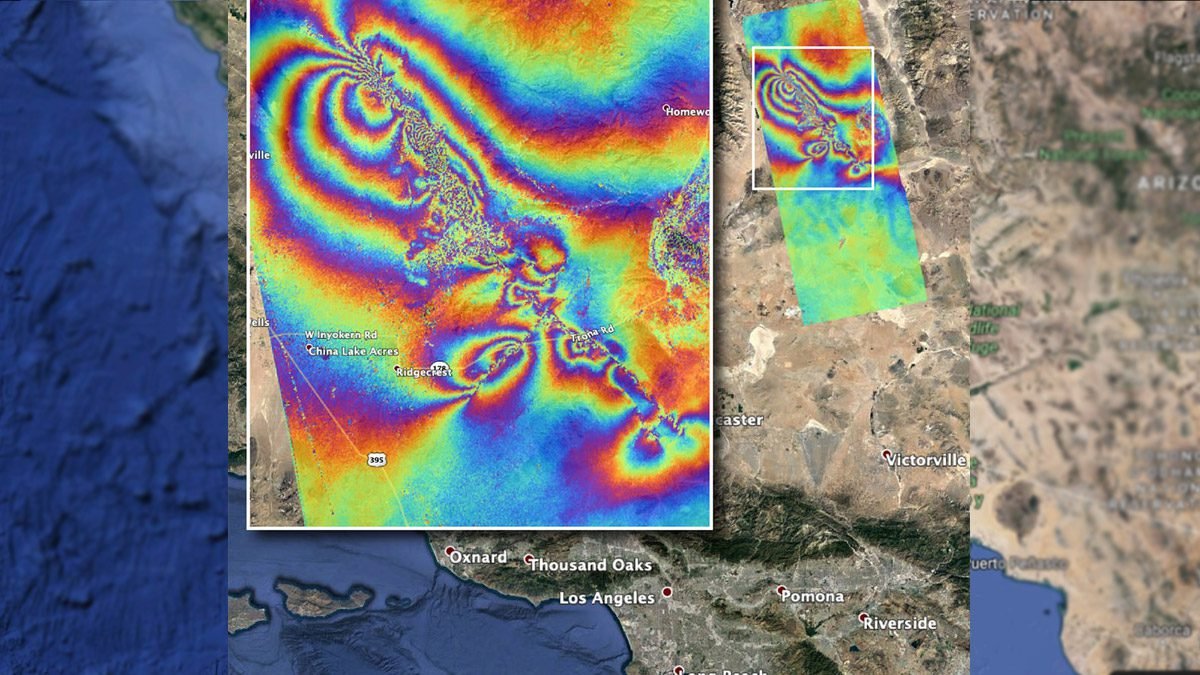
Southern California was hit with two massive earthquakes back to back on the 4th and 5th of July. The two earthquakes bore the magnitude of 6.4 and 7.1 on the Richter scale, respectively. The impact of the earthquakes and the damage that followed were so huge that it could be seen from space. The epicenter of the earthquake was near the city of Ridgecrest, about 241 kilometers northeast of Los Angeles. The U.S Geological Survey confirmed that the 7.1 quake was the largest earthquake to hit Southern California in some 40 years.
In order to make an estimate about the surface displacement from the earthquakes, the Advanced Rapid Imaging and Analysis (ARIA) team at NASA’s Jet Propulsion Laboratory in Pasadena, California, used synthetic aperture radar (SAR) data from the ALOS-2 satellite, courtesy of the Japanese Aerospace Exploration Agency, to produce a map of the same. The image showing the displacement was acquired on 8th July 2019 and is compared with the data acquired on 8th April 2018 of the same region.
The Interferometric Synthetic Aperture Radar (InSAR) map was released by NASA on their official website. In the picture, each color cycle represents 4.8 inches or 12 centimeters of ground displacement either toward or away from the satellite.
The surface rupture caused by the earthquakes is indicated by the linear features that cut the color fringes in the southeast. The northeast areas, which appear to be “noisy” may indicate locations where the ground surface was disturbed by them. This map is being used by state and federal scientists to assess the damage and map the faults that broke during those two earthquakes and the thousands of aftershocks that followed.
The USGS has reported that the region has experienced as much as 1,000 aftershocks if not more after the second earthquake on July 5th. NASA’s Earth Science Disasters Program has joined hands with the California Earthquake Clearinghouse which is also working with the California Air National Guard, the USGS and the Federal Emergency Management Agency.
